Analyze the performance of automated triggers and workflows, including metrics such as execution rates, engagement, and success or failure outcomes. This data helps refine and improve the effectiveness of your automated processes.
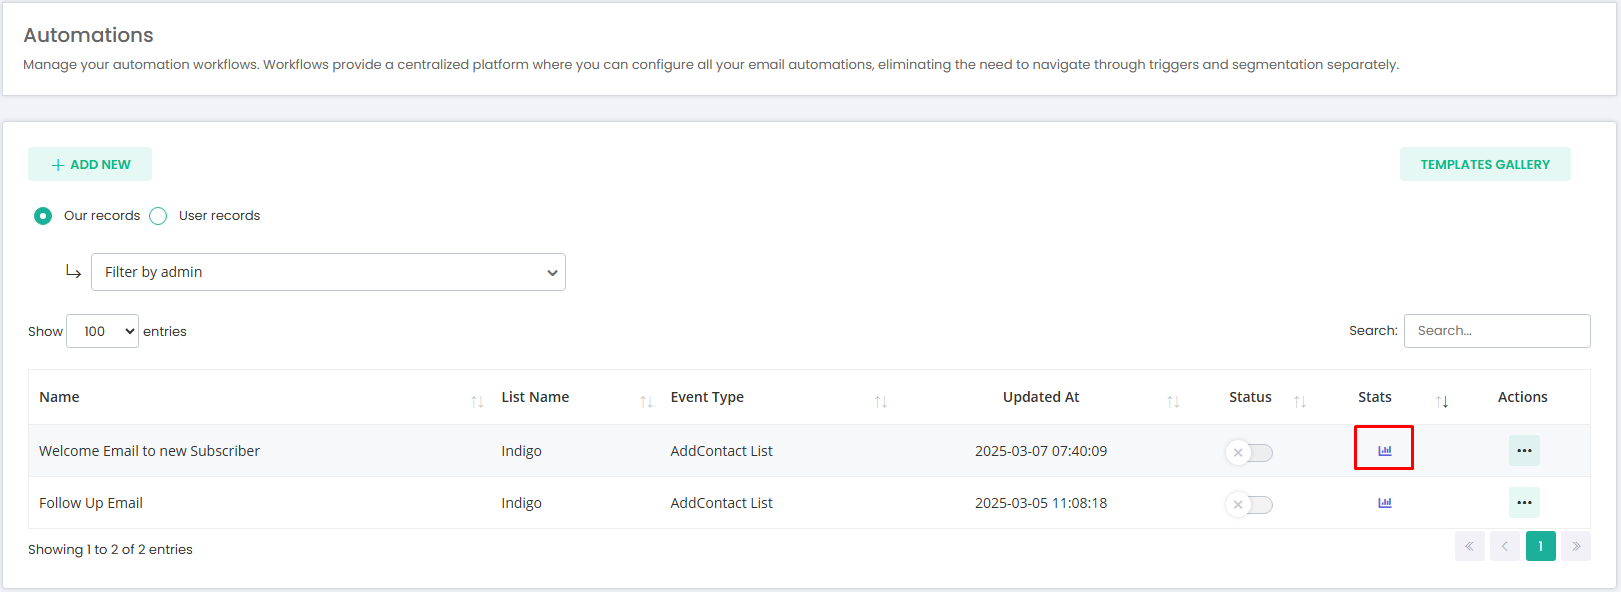
If you click on the stats on the view Automation page, it will redirect you to the Automation Stats Chart page. where you can check the Automation Insights.
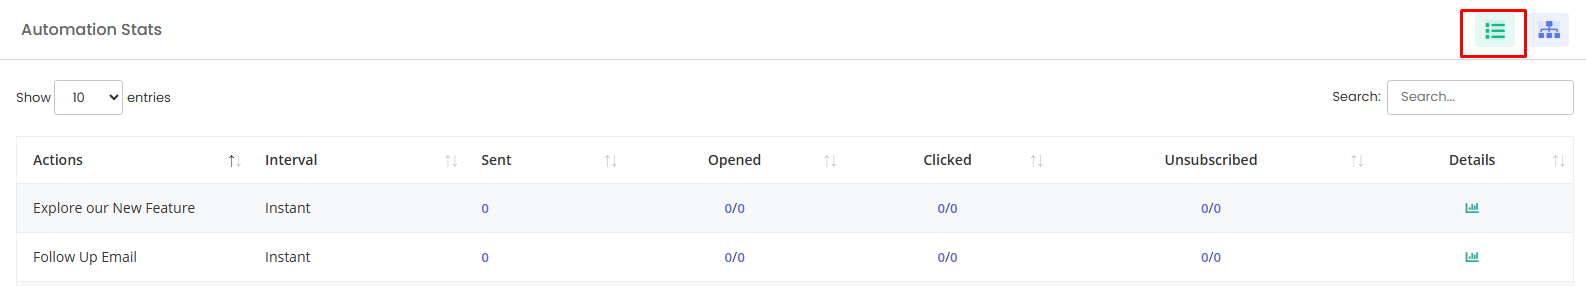
The List View presents all Automation Action statistics in a table format with pagination, allowing you to navigate through data efficiently. It also includes a search bar for easy filtering.
Column Name | Description |
Actions | The name of the Automations actions. |
Interval | The time at which the actions perform. |
Sent | The number of contacts an email is sent. |
Opened | The number of times an email is opened. |
Clicked | The number of times an email is clicked. |
Unsubscribe | The number of times a contact has unsubscribed. |
Details | Click here to see the detailed statistics for this Automations action. |
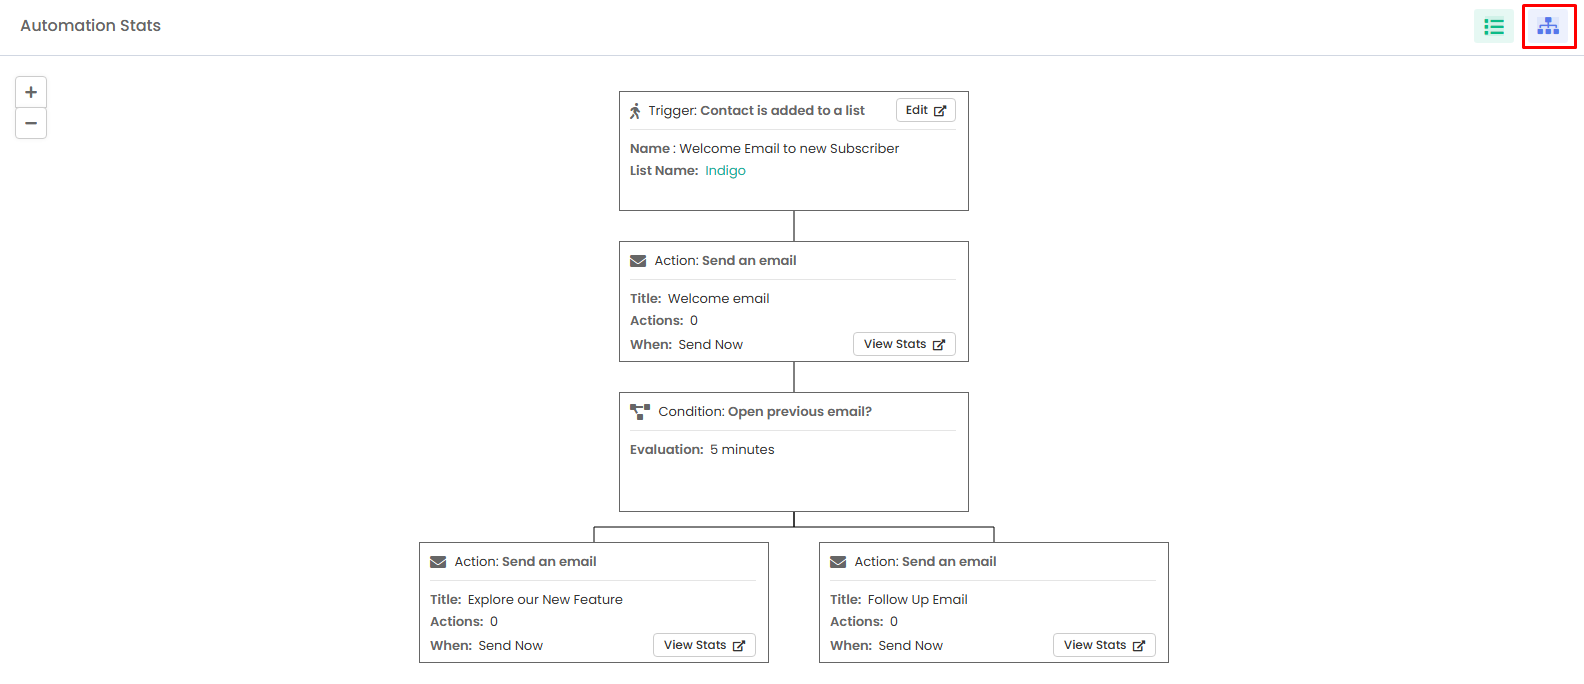
The Chart View provides a visual representation of automation performance, making it easier to interpret data trends at a glance.
Form Fields | Description |
Edit | Redirect you to the edit Automation page. |
View stats | Click here to see the detailed statistics for this Automations action. |